Resource Monitoring – vPanorama: Get the Big Picture (for FREE!)
Last week (or it may have been the week before) Jason Boche tweeted a question “Have you seen vpanorama.com?” Nope I had not, I had not even heard of it, so I checked out the site, downloaded the appliance, and spun it up in my lab.
The appliance is distributed as an OVF and can be imported into your environment or into Workstation. The set up of the appliance is done from the console with a text based menu.

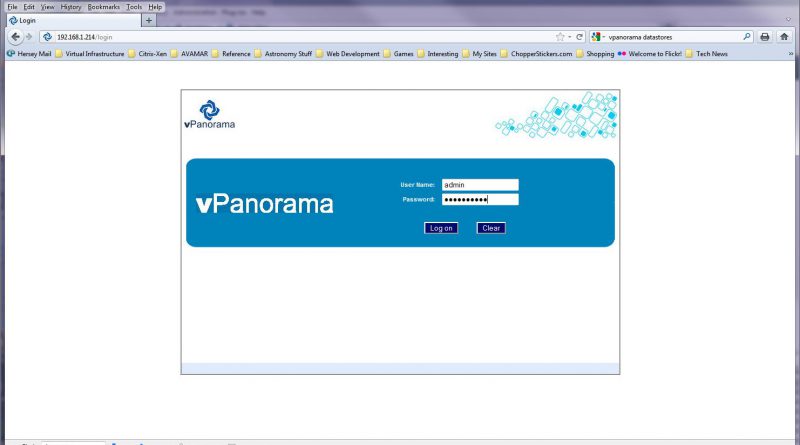
After configuring the IP address on the console you connect to the appliance via a web browser and a wizard runs to step you through licensing the appliance and adding your managed hosts. There are two license files provided when you download the appliance, one pro and one free. The pro license is good for 60 days and gives you access to all features. The free license does not expire but it looks like with this license you cannot apply storage and hosts recommendations (vMotion or storage vMotion).
When vCenter is added the ESXi hosts are discovered and you select them to be managed. Discovery of networks and datastores then takes a few minutes (probably a lot faster in a production environment).

Initially vPanorama did not discover any of my datastores. I sent a tweet about the issue to see if anyone else had run into this issue and received a tweeted response from @vPanoramaNews and an email from vPanorama support. There is a known issue with “slower” environments. vPanorama support quickly provided a patch that fixed the issue. The patch itself was easy to install and could be applied through the browser interface.
Here is the Panorama view of my lab environment. The Panorama view shows space, latency, IOPs, and traffic on the datastores. It also displays the CPU and Memory usage of the hosts and connection to distributed virtual switches. It connects storage to hosts to networks to give a nice graphical overview. There is a configuration option to be able to view ESXi local disks but I could not get that to work. I sent an tweet to vPanorama about it, will see what they come up with.

From the Panorama view you can mouse over the objects (datastores, hosts, switches) to get access to more detailed usage reports and recommendations. From the storage and hosts recommendation screens you can initiate a VM vMotion or a storage vMotion.

There is also a dashboard view that provides a very nice overview of network resources, CPU utilization, memory utilization, alerts and critical events.

One thing that vPanorama lacks that would be nice is a way to configure an alarm/alert/event to generate an email or SNMP message. Reports can be generated in PDF or HTML but it would be nice if they could also be scheduled and emailed.
Even with the lack of email alerts and the issues with displaying local datastores vPanorama is a nice FREE virtual infrastructure monitoring appliance. From the few tweets and emails I have traded with vPanorama I think they are also interested in adding features that may be useful and want to hear from folks that have tried out the product. I suspect the issue with the local disks and the lack of email alerts will be addressed.
If you are looking for a resource monitor vPanorama is worth taking a look at.
Here are a few more screenshots of different vPanorama views and reports:


Nice write up Hersey! Thanks for taking that tweet and running with it.
Jas
Pingback: Open Tabs 1/6/2012
You forgot to mention that it is only free if you have under 250 VM’s. 🙁