I was messing around with PowerCLI and the real-time statistics to collect the IOPS used by virtual machines/virtual machine disks in my my home lab. Virtual disk performance counters are available in the real-time performance stats but at the default statistics level, Level 1, the IOPS statistics are not rolled up into the historical performance statistics (daily, weekly, monthly, yearly). To get per device level statistics the statistics level has to be set to at least Level 3.
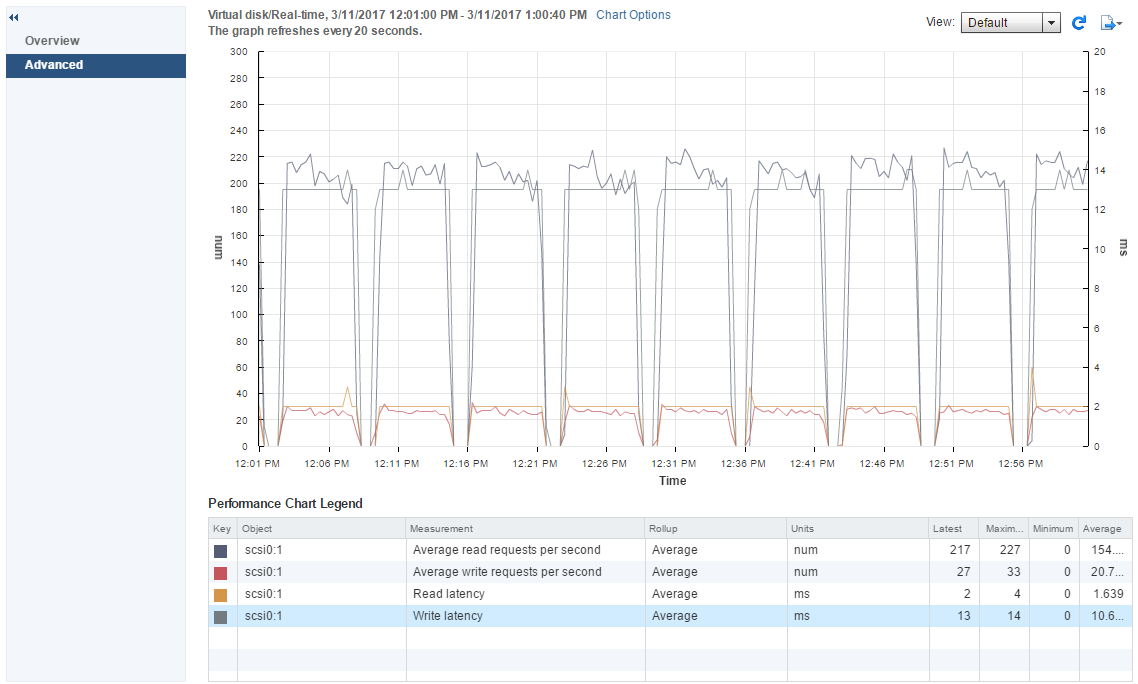
Here is an example of the real-time chart in the vSphere Web Client which shows the read/write requests per second, and the read/write latency for a single virtual disks:
I adjusted the virtual disk chart options selecting counters for NumberReadAveraged, NumberWriteAverage, TotalReadLatency, and TotalWriteLatency for virtual disk scsi0:1 on LABFILE01. If the the default statistics level has not been changed these counters are only available real-time and are only kept for the past hour.
To collect these counters past the hour which displays in the real-time statistics I put together a PowerCLI script, collect-iops.ps1, which uses the Get-Stat Cmdlet to collect the real-time samples and save each sample for each virtual machine, and each virtual disk, to a csv file.
In the real-time stats the NumberReadAverage and the NumberWriteAverage are the average of the Read/Write commands (IOPS) issued per second to the virtual disk during the collection interval (20 second sample). Here are the details on the available virtual disk counters.
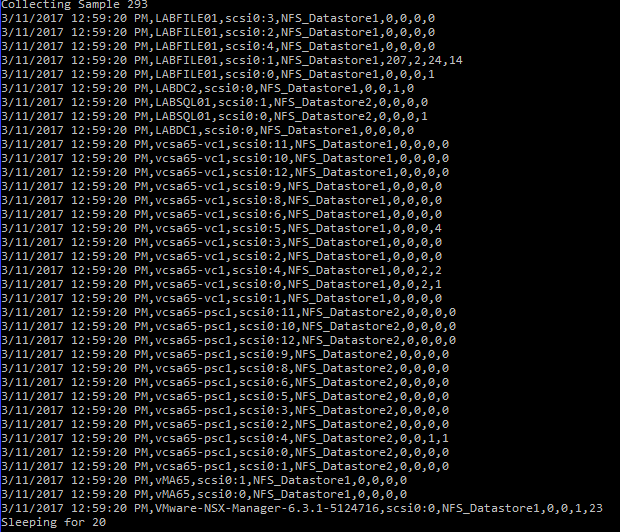
The script, collect-iops.ps1, collects the same 20 second real-time samples for NumberReadAveraged, NumberWriteAverage, TotalReadLatency, and TotalWriteLatency for each virtual machine disk. I had a script running in LABFILE01 reading and writing to virtual disk scsi0:1.
Each real-time interval collected from Get-Stat is written to a csv file ($file). Each line in the file contains the following information: TimeStamp (the interval’s timestamp), VM (the name of the VM), Disk (the VM’s virtual disk), Datastore (the datastore the virtual disk is stored on), ReadIOPS (the NumberReadAveraged value), ReadLatency (the TotalReadLatency in ms), WriteIOPS (the NumberWriteAveraged value), and WriteLatency (the TotalWriteLatency in ms).
The number of intervals to save is defined in $samples. This is the number of 20 second intervals to collect: 180 samples is equal to 1 hour of 20 second intervals, 1080 samples is equal to 6 hours, 4320 samples is equal to one day (24 hours). Once I got everything working right, I collected 24 hours of intervals, 4320, for my lab which included 36 virtual disks (across 7 VMs) and the csv file was a little less than 10 MB.
Once you have collected all the samples you will have all the data you need to view information for VMs, datastores, or virtual disks. Here are a couple of powershell examples for pulling the data out of the csv:
$iopsdata = Import-CSV Collect-IOPS.csv

#Extract the stats for a single VM
$VMIOPS = $iopsdata | Where {$_.VM -eq "LABFILE01"}

#Extract the stats for a single Datastore
$DSIOPS = $iopsdata | Where {$_.Datastore -eq "NFS_Datastore2"}

#Get Total Average Read and Write IOPS for all VMs/virtual disks per Interval
$TOTALAVGIOPS = $iopsdata | Select-Object -Property * -Exclude Disk,VM,Datastore | Group-Object -Property TimeStamp,Instance | %{
    New-Object PSObject -Property @{
        TimeStamp = $_.Name
        ReadIOPS = ($_.Group.ReadIOPS | Measure-Object -Sum).Sum
        WriteIOPS = ($_.Group.WriteIOPS | Measure-Object -Sum).Sum
    }
}
If you are handy with Microsoft Excel, you can import the data from the csv and create graphs. I am not handy with Excel but I was able to generate a nice graph of the Total Average Read/Write (stacked) IOPS across all virtual disks for a full day (24 hours):
I will probably make a few changes to the script to take the vCenter Server, output file, and number of samples as parameters instead of as variable in the script but for now it does what I need it to do.
4 thoughts on “Collect Virtual Disk IOPS with PowerCLI”
The script is displaying the following error message:
Start-Sleep : Cannot validate argument on parameter ‘Seconds’. The argument is null, empty, or an element of the argument collection contains a null value. Supply a collection that does not contain any null values and then try the command
again.


The script is displaying the following error message:
Start-Sleep : Cannot validate argument on parameter ‘Seconds’. The argument is null, empty, or an element of the argument collection contains a null value. Supply a collection that does not contain any null values and then try the command
again.
Referencing the following line:
start-sleep -s $interval
Which get its data from
$stats = Get-Stat -Realtime -Stat $metrics -Entity ($vms | Where {$_.PowerState -eq “PoweredOn”}) -MaxSamples 1
$interval = $stats[0].IntervalSecs
Any idea why this is occurring?
Thank you – that addressed the issue I had. Very nice script! Thanks.
Dan
I think this is happening because the $interval variable has scope limited to within the function Collect-IOPS.
I’m a novice, so please take this change with that caveat.
I changed the line
$interval = $stats[0].IntervalSecsto:
$script:interval = $stats[0].IntervalSecsI think Jason hit the nail on the spot. I got the same error, but setting the variable visible from outside the Collect-IOPS function made it work.
Thank you guys